animal health consulting
CardioCare by Purina
what does the science really say?
Christine King BVSc, MANZCVS (equine), MVetClinStud
"Purina Pro Plan Veterinary Diets CC CardioCare represents a breakthrough in the role nutrition offers for dogs with early stage mitral valve disease. The novel scientific approach has led to the development of a transformational diet that slows progression of the condition in dogs." — Dr. Jason Gagne, DVM, DACVIM (Nutrition)
Let's continue examining this claim by looking at the other 'primary outcomes', both of which involve measuring the diameter of the left atrium.
First, a quick overview of the structure of the heart in dogs. (Still looking for an illustration I like...)
The heart has 4 chambers, separated into 2 pairs (left and right) by a muscular wall, the septum. Each pair comprises an atrium (upper) and a ventricle (lower), separated by a valve.
On the left side of the heart, the atrioventricular (AV) valve is called the mitral valve. It sits between the left atrium and the left ventricle. As the heart beats, the path of oxygenated (arterial) blood flow through the left side of the heart is as follows: lungs → left atrium → left ventricle via the mitral valve → aorta via the aortic root.
On the right side of the heart, the AV valve is called the tricuspid valve. It sits between the right atrium and the right ventricle. As the heart beats, the path of de-oxygenated (venous) blood flow through the right side of the heart is as follows: body → right atrium → right ventricle via the tricuspid valve → lungs via the pulmonary artery.
The full name for the most common type of mitral valve disease in dogs, and the focus of this paper, is myxomatous mitral valve disease, or MMVD. To keep things simple, what with all the acronyms in this paper, I'm just going to call it mitral valve disease.
Left atrial dimensions (summary)
After severity of mitral regurgitation, the other two primary outcome measures were these:
* diameter of the left atrium (LAD), measured in centimetres, during diastole (i.e., during relaxation of the left atrium)
* ratio of LAD to the diameter of the aortic root (LA/Ao); this ratio accounts for differences in size between dogs by making each dog its own internal reference standard
These are important variables to monitor because enlargement or 'dilatation' of the left atrium develops and worsens over time as the incompetence of the mitral valve increases (as the degenerating valve lets increasingly more blood 'jet' back into the left atrium with each heartbeat). In contrast, a competent mitral valve prevents backflow of blood into the left atrium as the left ventricle contracts.
But here is where the paper gets rather ridiculous. The authors try to distract us with intricate details, reporting values down to the second decimal place (one-tenth of a millimetre), when in reality there is a "fudge factor" in echocardiographic measurements that isn't talked about very much, and is admitted even less!
To compare measurements down to 0.01 cm (0.1 mm) in a structure whose diameter is approximately 2 cm (20 mm) is to proceed with confidence in the assumption that the margin of error inherent to performing this procedure on a beating heart is less than 0.1 mm or 1/200th of its diameter.
In addition, the authors greatly enlarge the scale of their graphs to exaggerate the effect size. And they use standard-error bars instead of standard-deviation bars to mask the huge variation between dogs within the same diet group and evaluation point.
(Remember that all but one of the dogs in each diet group was an adult Beagle, and all had early or 'preclinical' mitral valve disease, graded as ACVIM Stage B1 or B2. By design, these were very homogeneous groups of dogs.)
In other words, their graphs are so simplistic and manipulated that they are misleading.
In hard numbers, the effect size over time is smaller than the standard deviation (the amount of variation between dogs in the same group). And that's all before we talk about how they disregarded their own threshold for statistical significance...
Now to the details.
Left atrial diameter (LAD)
As a reminder, this is simply a measurement of the maximum diameter of the left atrium at its most relaxed. It is measured in centimetres (cm). It's also worth noting that 1 cm = 10 millimetres (mm).
CON diet
In the 8 dogs fed the Control diet, the average or 'mean' LAD increased from 1.97 ± 0.41 cm at baseline (at the start) to 2.12 ± 0.37 cm at 6 months. That sounds bad! Any increase is undoubtedly heading in the wrong direction...
Mean is the statistical term for the average: add up all of the individual values, then divide the result by the number of individuals in the group. But that's not the only number of importance; the spread of individual values around that single, calculated 'mean' is equally important. That's where standard deviation, or SD, of the mean comes in.
In this article, the number after the plus-or-minus symbol (±) is the standard deviation of the mean. It generally encompasses about 68% of the values for the group. In other words, a little over two-thirds of the dogs in that diet group, at that evaluation point, are represented by the span of the mean ± SD. (When we aren't given the full range of values, we can add and substract the SD to and from the mean to get the spread of values which represents two-thirds of the dogs in that group.)
But note that the mean increase (0.15 cm, or 1.5 mm) over 6 months is more than 2-fold smaller than the standard deviation at 6 months (0.37 cm), and almost 3-fold smaller than the standard deviation at baseline (0.41 cm). In other words, the standard deviations for the group from beginning to end swallowed this increase whole!
(Scroll down to see what that looks like, in colour... And then come back; we have a lot more to examine.)
Not surprisingly, this increase was not statistically significant by the study's own criteria, which set statistical significance at P < 0.017.* (The comparison between baseline and 6 months yielded a P value of 0.022.)
*Appropriately, they made a Bonferroni correction for multiple comparisons. However, they were rather too liberal with themselves, adjusting with a K value (number of comparisons) of only 3, when by my count they made at least 20 separate comparisons. (They report 20 separate P values in their supplemental tables.) So, they should have set statistical significance at P < 0.0025 (which is 0.05/20) rather than P < 0.017 (which is 0.05/3). By this more rigorous standard, none of their results was statistically significant. Not one.
In fact, they made many more comparisons than the 20 for which they reported P values. The threshold for statistical significance should have been even lower than P < 0.0025.
When the number of comparisons in a study exceeds 13, there is more than a 50% likelihood that at least one of the P < 0.05 results will have occurred purely by chance, rather than because of real differences between the two groups or time points. With 20 comparisons, the likelihood of at least one "significant" result occurring purely by chance is 65%, and there's no way of knowing which of the "significant" results is spurious. In other words, there's a good chance that at least one of their "statistically significant" results is spurious. But which one?
As the number of comparisons increases, so does the uncertainty, unless a Bonferroni correction is used which accounts for all of the comparisons made. That's because the inherent uncertainty in accepting a threshold of P = 0.05 (5% chance of a spurious result with each comparison) is cumulative. By using a more rigorous threshold, we can have more confidence that the results are reliable when applied to other dogs, including our own. When P = 0.017, there's only a 1.7% chance of a spurious result with each comparison; and when P = 0.0025, the chance of a spurious result is reduced to less than 1% (0.25%, to be exact, or 1 in 400 comparisons).
But let's continue, using their ... er, generous threshold of P < 0.017.
CPB diet
In the 10 dogs fed the CardioCare prototype, the mean LAD decreased from 2.04 ± 0.41 cm at baseline to 1.97 ± 0.31 cm at 6 months. That sounds good! Any decrease is undoubtedly heading in the right direction...
But note that the mean decrease was only 0.07 cm (0.7 mm) after 6 months. It is more than 4-fold smaller than the standard deviation at 6 months (0.31 cm), and about 6 times smaller than the standard deviation at baseline (0.41 cm).
This decrease was not statistically significant; not even close! (The comparison between baseline and 6 months yielded a P value of 0.24. That is not a typo.)
Comparing the two diets
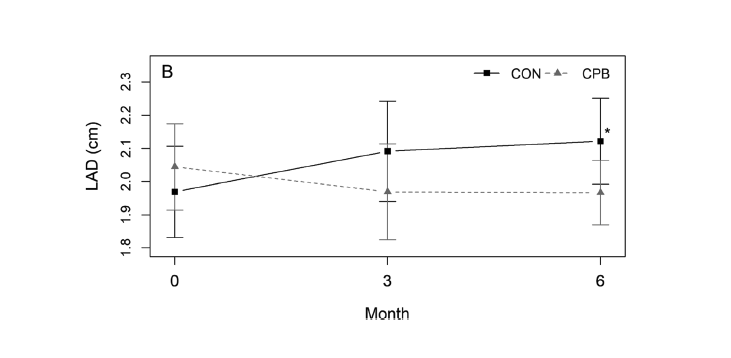
The graph below is how they illustrated these data, presenting means, standard error bars (which are always much smaller than SD bars), straight lines that imply direct linear relationships between evaluation points that may not actually exist, and a greatly enlarged scale.
Standard error of the mean (SE or SEM) is not about expressing how much individual variation there is within the group. Rather, it's a calculation that tries to pin down how well the mean for the group can be expected to represent the mean for the broader population (e.g., all dogs with early mitral valve disease fed that diet). It is an alternative to calculating confidence intervals.
The SEM is calculated by taking the SD of the mean and dividing it by the square root of n (number of animals in the group). Whenever SEM bars overlap, as they do at all time points in this graph, confidence is low that the difference between the two means (e.g., comparing the two diets) is significant — and, more importantly, has real-world significance — particularly when the error bars of one group approach or encroach on the mean of the other.
The SEM bars are basically saying "we think the population mean is probably somewhere within this range." (See the next page for a discussion of the population mean, and why it's important. Trust me, you'll be glad you did.)
Using SEM rather than SD is a common trick that is used to mask how much variation there is among individuals in the group. It's a great way to emphasise small and unimportant differences between groups, while masking how much variation there is within each group.
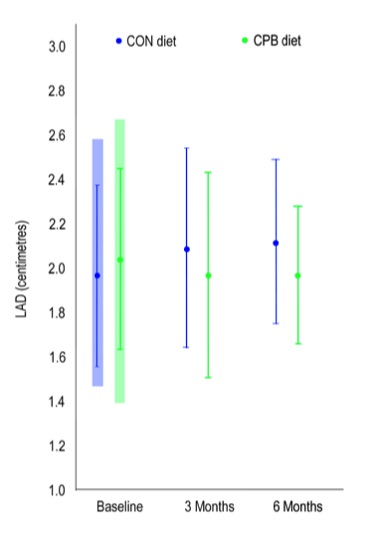
In this graph, I've shown each mean as a coloured dot (blue for CON and green for CPB), with the standard deviation (SD) for each diet group and evaluation point as a vertical line extending above and below its mean. (That is, these bars are SD rather than SEM.)
At baseline, we're also provided with the full range of values (minimum and maximum) for the diet group. We aren't given the ranges for the other evaluation points, so I've simply added a shaded bar behind the baseline means and SDs to represent the range for each diet group at the start.
As you can see, there is huge variation among dogs, even within the same diet group. I would have overlaid these SD bars onto the paper's own graph, but they extended way beyond the bounds of the graph.
With spreads like these, in such small and homogeneous groups of dogs, it is no wonder that there were no statistically significant differences between the two diets after 6 months. I don't know how this paper cleared peer review.
***
So, they tried another tack: they looked at the change in LAD at 6 months as a percentage of the baseline LAD for each dog on the CPB diet and then compared them with the figures for the dogs on the CON diet.
That's fair enough. It's using each dog as its own control, and that's valid. (Unless they hadn't planned to do that at the design stage. If they added it later, after all the data were collected and analysed, what is called 'post-hoc' analysis, it's a bit of a no-no, and quite the red flag.)
But even that was a bust. The P value for this comparison ('LAD % change from baseline') was 0.025, when their threshold for statistical significance was P < 0.017 (and probably should have been < 0.0025).
This sort of shenanigans is called p-hacking in research circles: torturing the data until it gives up a p value that you like, one that shows a statistically significant difference.
Trouble is, they still didn't get there!
In yet another example of overstating their findings, the dogs fed the CPB diet had, on average, less than a 3% decrease in LAD over the 6 months (mean of -2.87%, to be precise). However, the standard deviation of this mean was more than twice the size of the change itself, ± 6.74%.
Simply put, some dogs on the CPB diet had an increase in LAD while others had a decrease.
(I won't bother to show you the graphs they provided for this contortion. You can see it yourself in the paper if you're interested. If you do, note that there are twice as many dogs as there should be in each diet group, at each evaluation point. Really, how did this paper pass peer review?)
The dogs on the CON diet had, on average, close to an 11% increase in LAD over the 6 months (mean of 10.77%, to be precise). However, the standard deviation of this mean was greater than the change itself, and about twice that of the dogs on the CPB diet, ± 12.65%.
Simply put, some dogs on the CON diet had an increase in LAD while others had a decrease.
When you take measurements of sizeable and constantly changing things — such as a dog's beating heart — and analyse those values down to a fraction of a millimetre (which is practically the microscopic level), you can contrive some statistically significant differences on paper that don't bear much relation to how the intervention (e.g., CPB diet) will perform in real life.
***
On the next page, I'll discuss the other measurement of left atrial diameter, the ratio of LAD to aortic root diameter (LA/Ao) — although I can tell you right now that it's just more of the same....
© Christine M. King, 2022. All rights reserved.
First published 19 September, 2022. Last updated 22 September, 2022.
Impressive graph, isn't it? And the asterisk beside the CON error bar at 6 months suggests that the difference between diets was statistically significant at that time point. It was not.
Bearing in mind that their own threshold for significance was P < 0.017 (and probably should have been much lower), there were no significant changes in LAD over time in either diet group. The only comparison that came close was the difference in mean LAD between baseline and 6 months in the dogs fed the CON diet (P = 0.022).
The compound effect of diet over time ('diet x time') yielded a P value of 0.037, which is apparently what that asterisk is meant to represent. But again, it was not statistically significant by their own criteria.
Here's what the data look like, plotted more realistically: